After a couple of years experimenting we managed to get long periods of data – up to two years of continuous data. The Probe Data has provided a wealth of information to be interpreted.

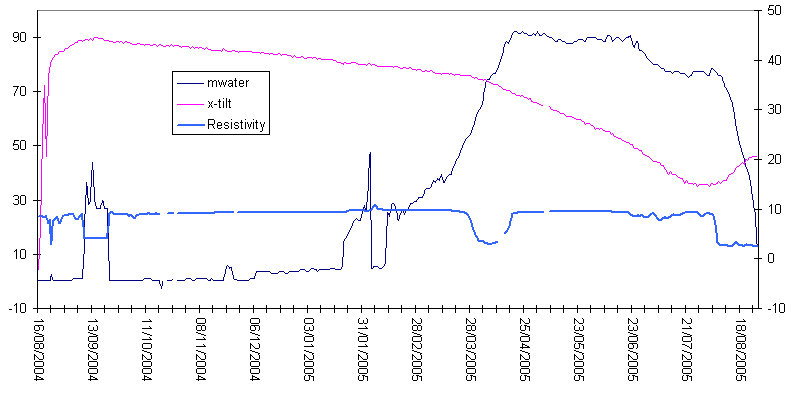
This is a sample of data from a 2004 probe (8) in Briksdalsbreen. The external pressure is shown as metres of water depth equivalent. and the x-tilt represents movement/rotation. Notice the changes brought by spring. Resistance shows if the sediment (till) is “dry” (when high) or “wet”.

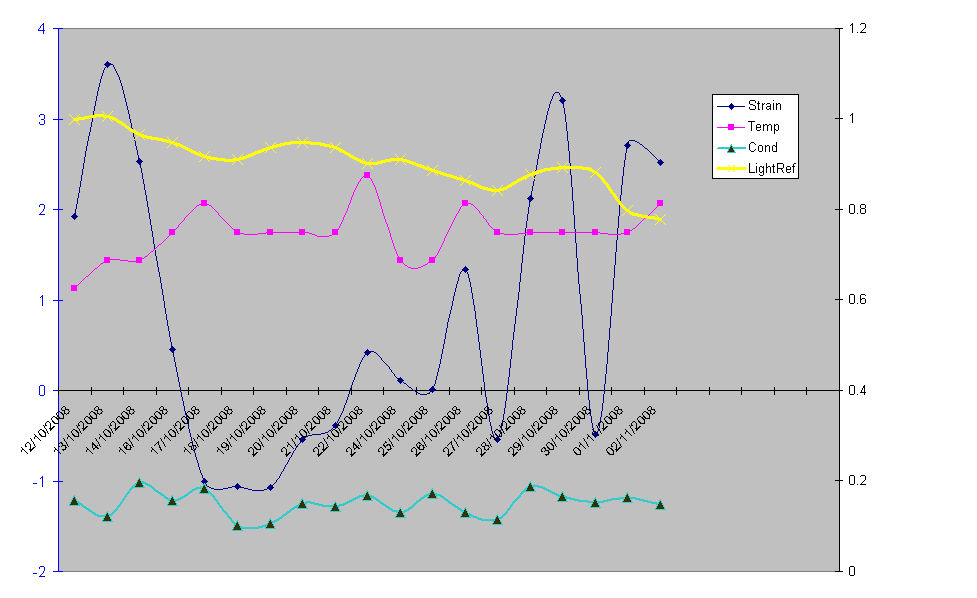
This sensor data is from Iceland 2008 (Temp is C others are relative). It shows the first data from the light reflectance sensor (yellow) which is reducing as the ice closes around the probe. It also shows interesting strain oscillations.

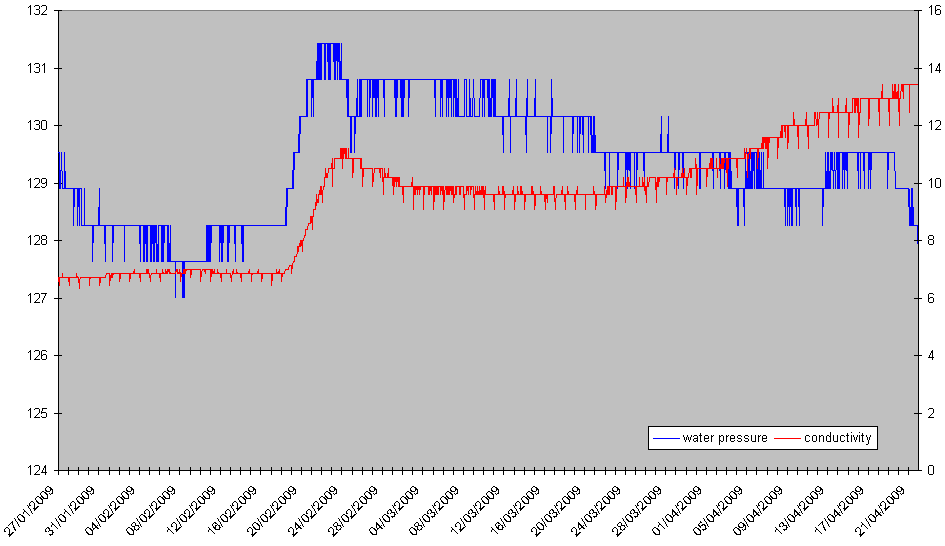
This sample of data from probe21 in iceland shows water pressures (converted to metres water equiv) increasing in Feb. along with electrical conductivity (right Y axis microSiemens) – from melting – even though the glacier surface was still snow covered.
All the data from Norway is available from our database.
A live-data graph of Iceland data is also available (warning prototype can crash firefox if too much data is selected)
Base station data and weather station data provide information about the glacier surface
Diagnostic data shows how the system is performing – a new source of information is the Image Data
