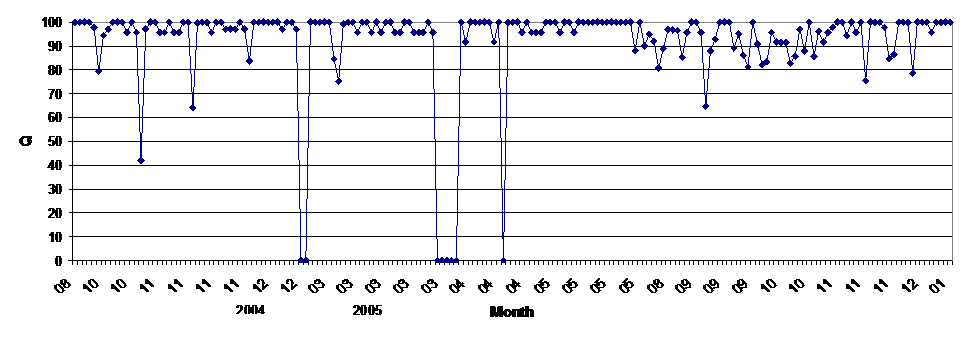
This graph shows the “quality” of the probe communications in the “star” system. Note the X axis is not continuous/linear (it shows the diagnostics we have).

This graph shows the "quality" of the probe communications in the "star" system. Note the X axis is not continuous/linear (it shows the diagnostics we have).

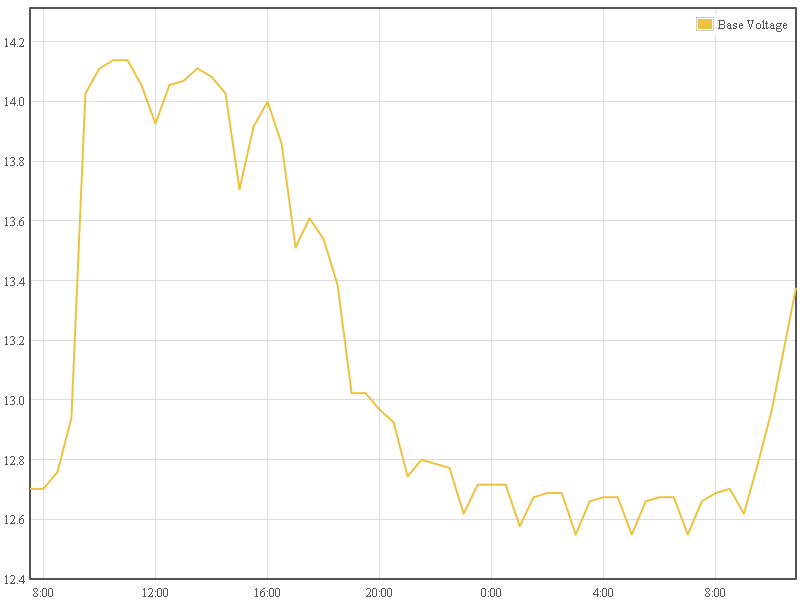
A 2009 base station battery voltage sample - showing the high level due to sun in the day and the small ripples/dips caused by the 4minute GPS recordings (which are fairly power hungry).
In June 2010 the base station woke up from winter.
