Web connected RTK GNSS to measure glacier change and flow
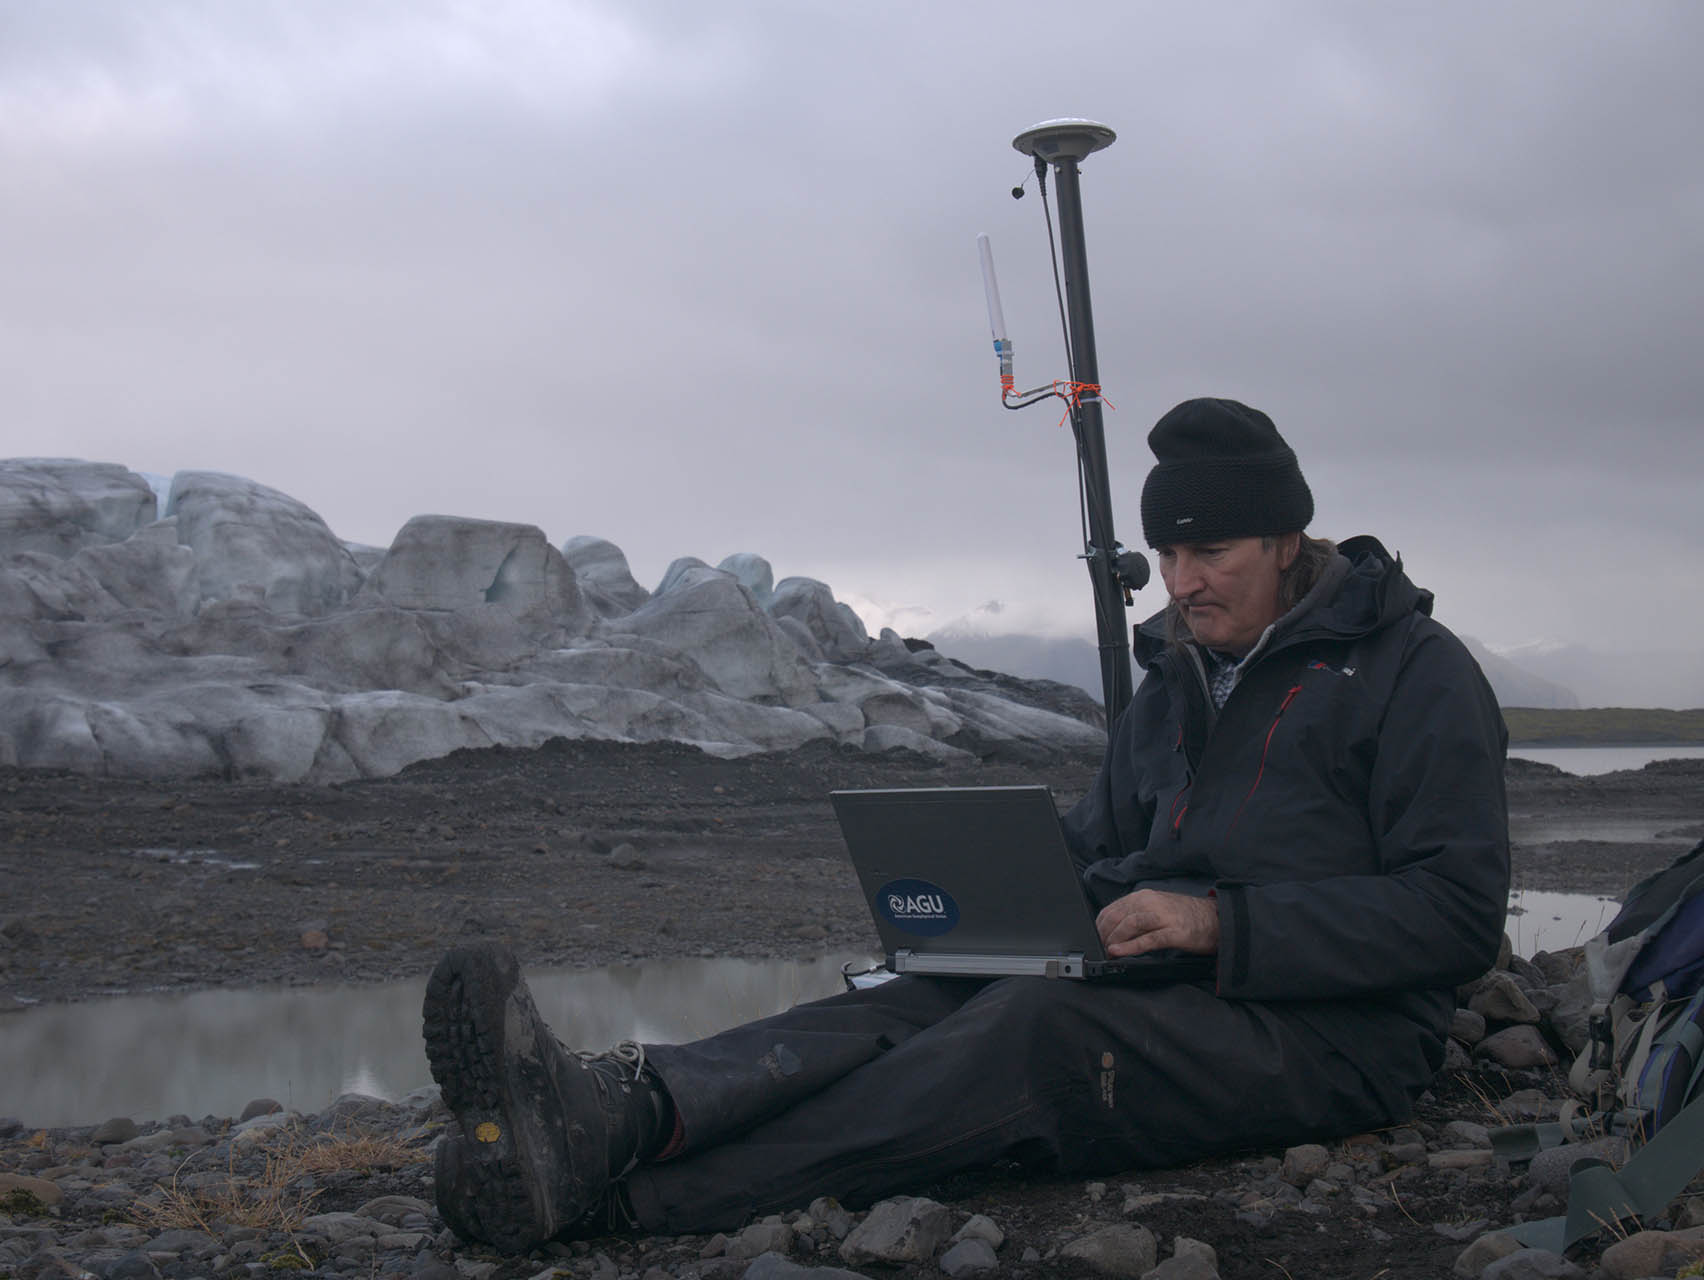
We are measuring ice flow with the help of new dGPS technologies. Earlier research used dGPS recordings with traditional high cost devices. Our research is using the latest generation of lower cost real-time kinematic dGPS so that more sites can be monitored for the same cost. It also means the loss of one unit in a glacier has a reduced financial impact. Our system automatically provides location measurements from synchonised dGPS units, which wait for a static RTK fix and then sleep between sessions. The readings are sent once per day to a web server via satellite communications, allowing the system to operate anywhere in the world. The fixes are accurate to around 2cm and they take less than two minutes to acquire (version1), with only 50 bytes to transmit (vs hundreds of kBytes with dGPS recordings). This reduces the power requirements by around a 50th and opens up the possibility of year-around live monitoring.
In 2016 we carried out a simple experiment to track an Iceberg with the help of Formula E. This helped us carry out trials in 2017. Thanks to National Geographic we extended the system in 2018 and monitored into 2020. See our interactive StoryMap. 2022 saw the start of a new project The role of subglacial soft bed hydrology on glacier response to climate change – It includes ice-tracker2 and UAV/remote sensing.
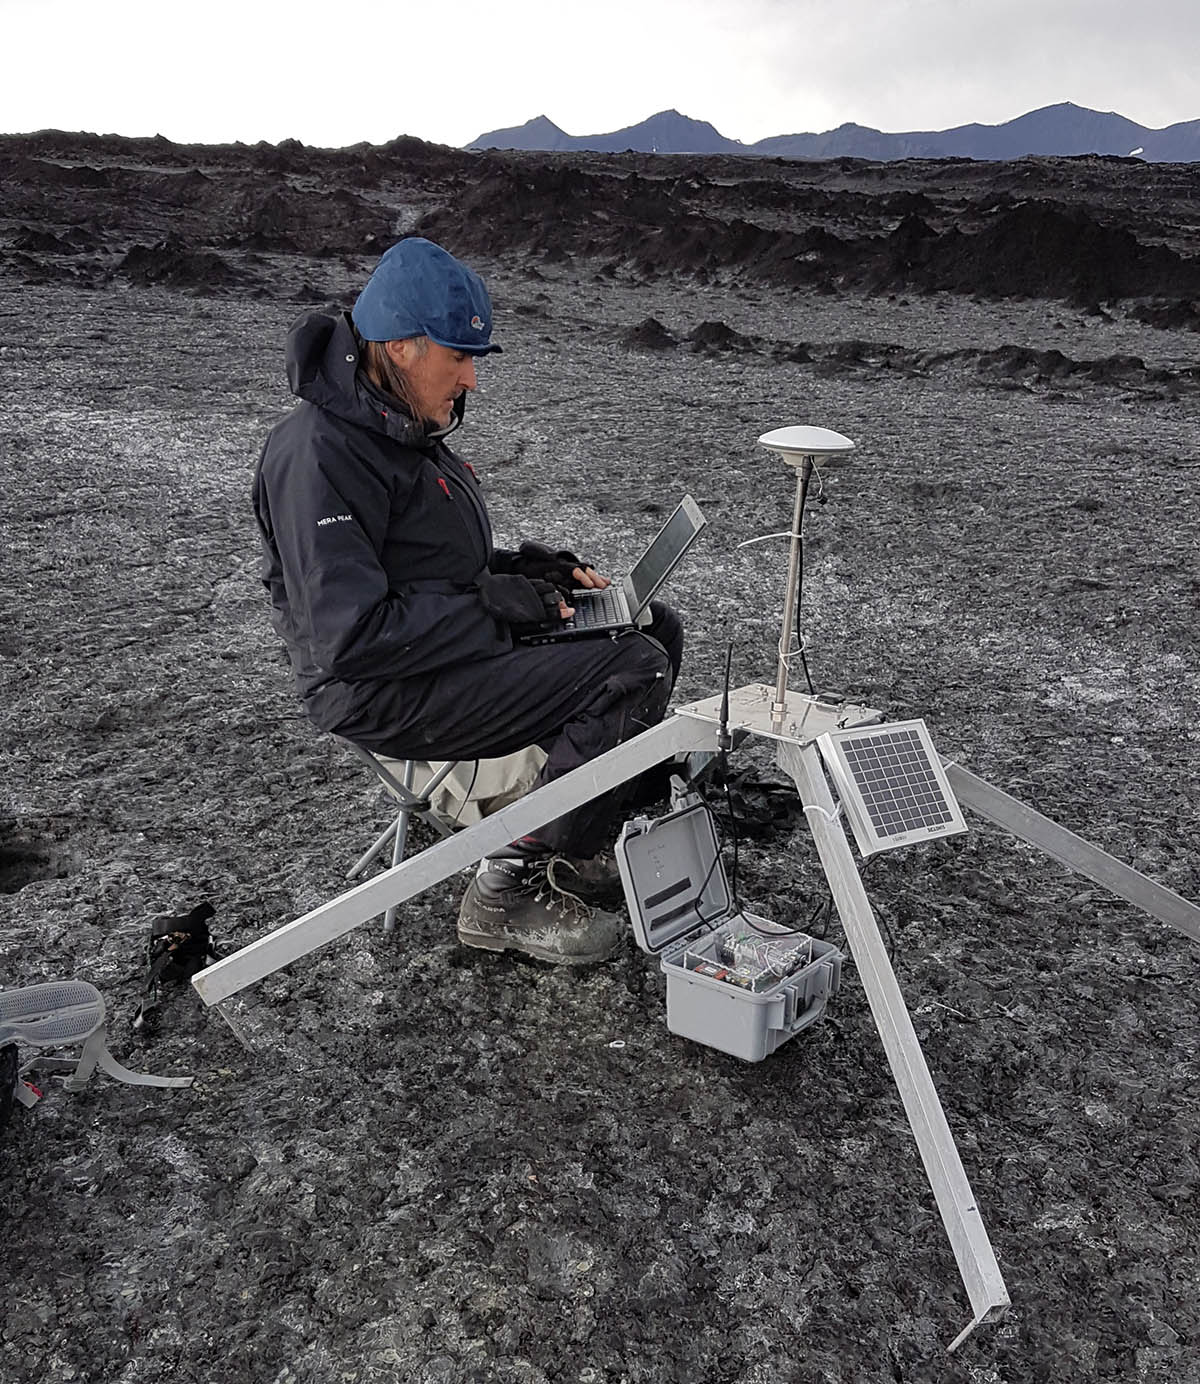
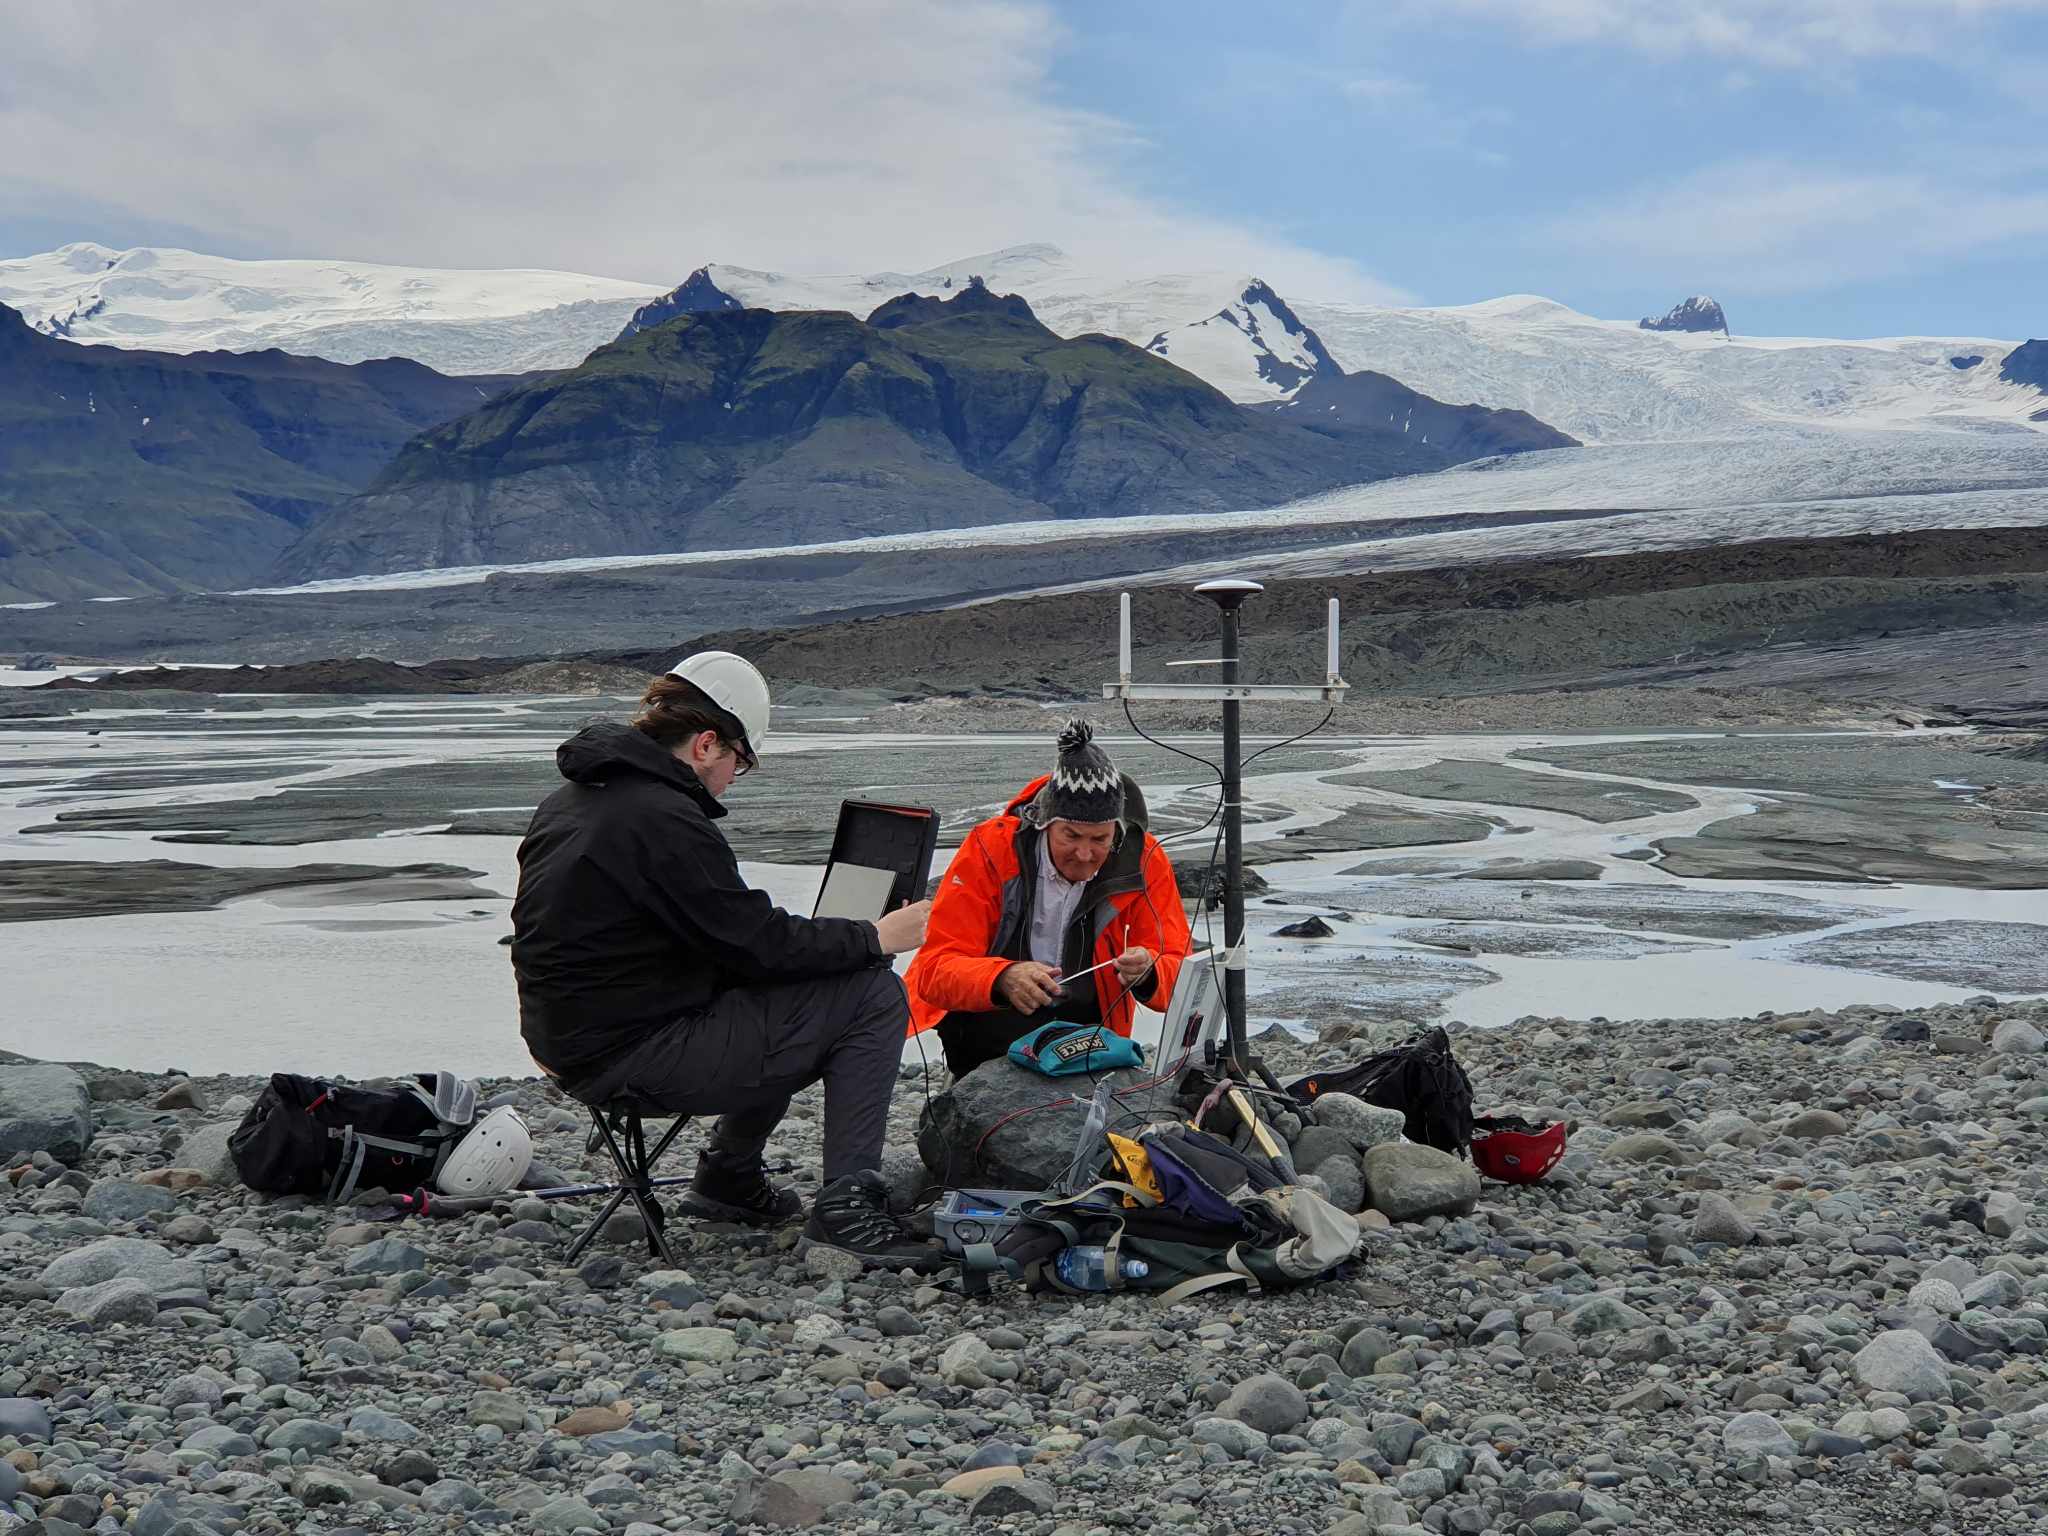
in 2017 we installed differential dGPS units on two Glaciers in Iceland. Each site has one fixed base station and one moving unit on a glacier. The two are synchronised to wake up when readings are needed. The location data are sent back to the UK via Iridium Satellite messaging and combined with other data to study the glaciers.
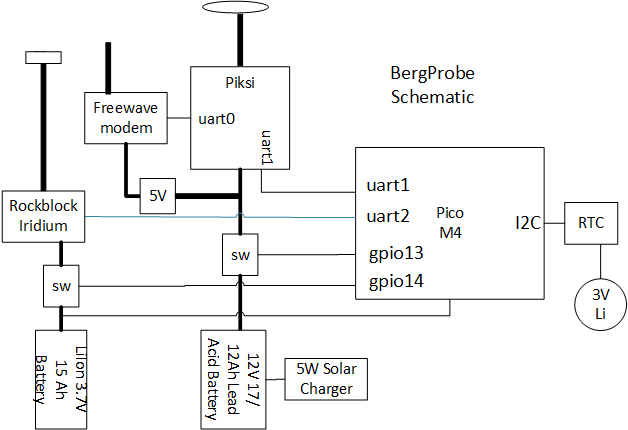
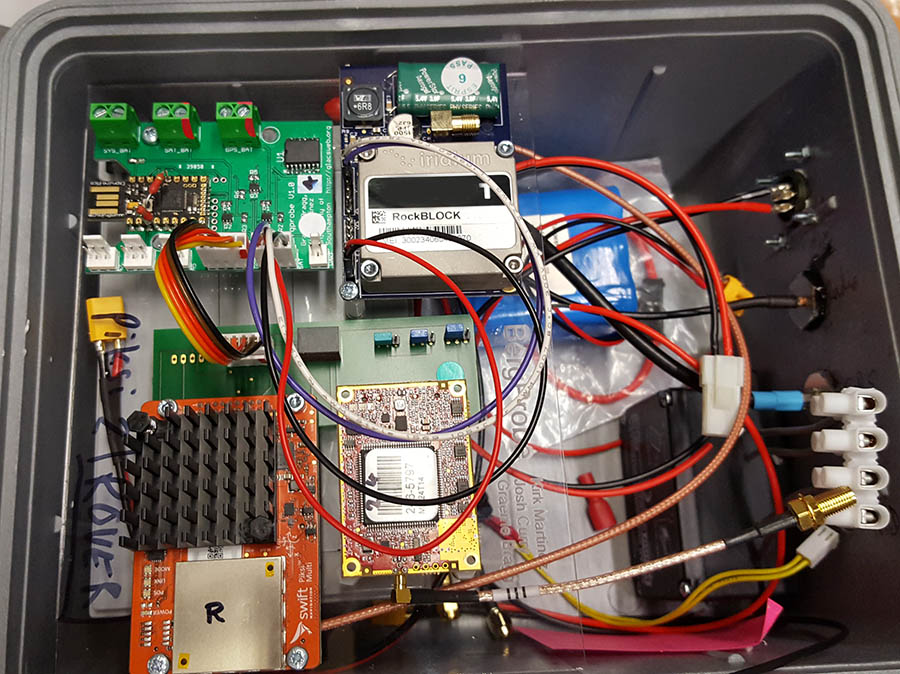
The dGPS units from Swift were linked to an Iridium Satellite-messaging unit (Rockblock) using a Python programmed Espruino Pico computer. See the schematic below for details.
We where able to see the data coming in every day. See our Blog.
Here is a Schematic of our original Piksi Multi based node showing how we power up the GPS/Iridium separately when we need them. Also the use of multiple batteries to increase capacity and avoid duplicating power supplies. The Espruino Pico was programmed entirely in MicroPython making it easy to adapt in the field.
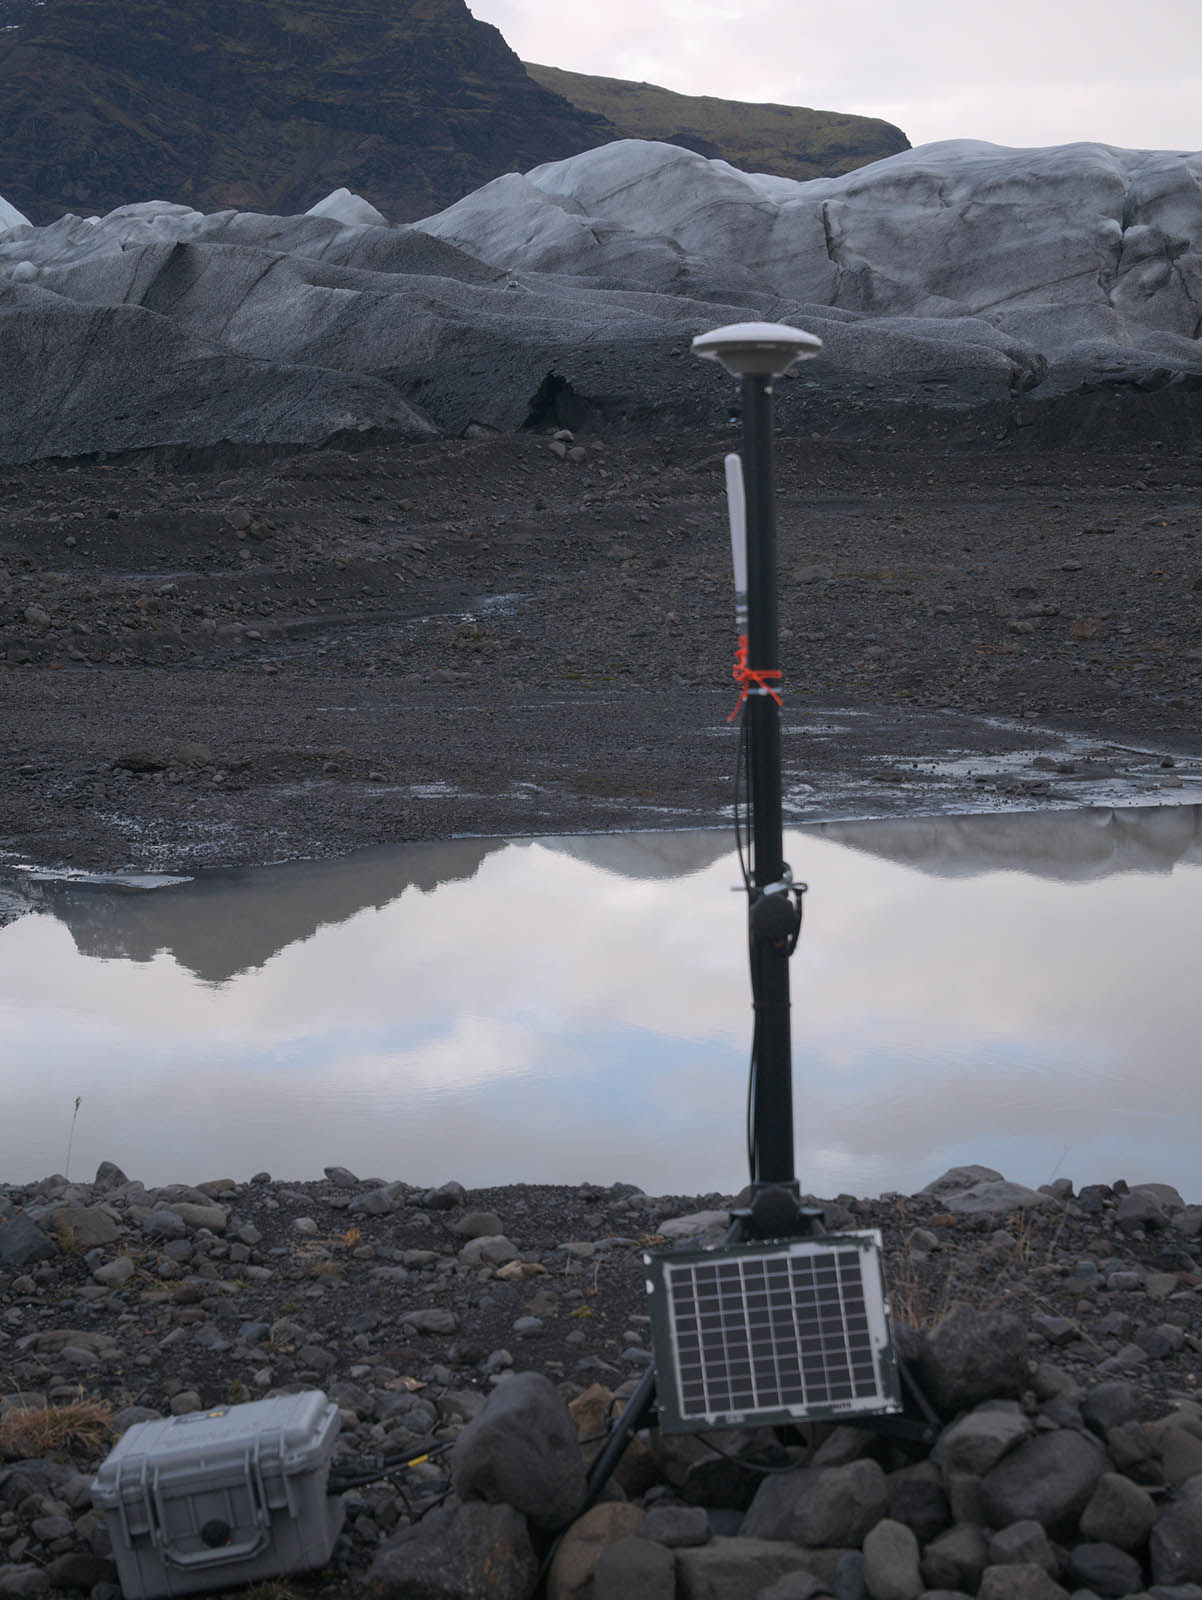
This is the second Fjalls base station location – covering a wider area of the glacier.
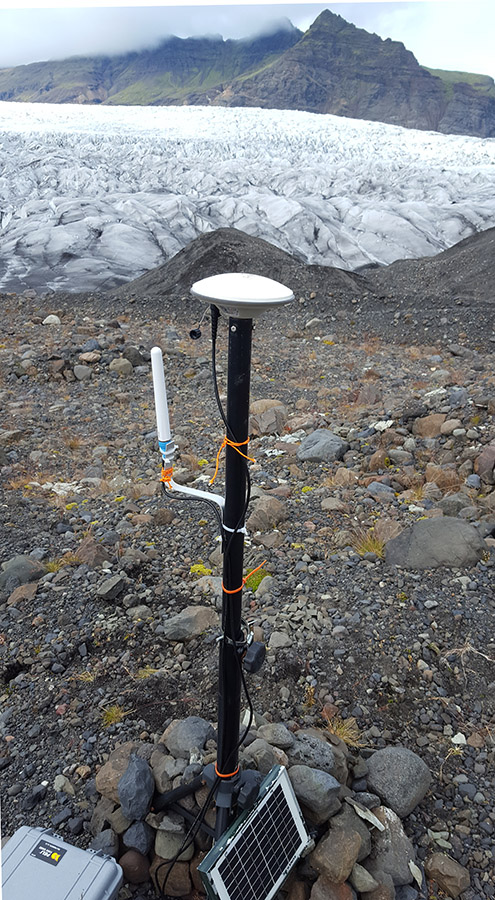
this is the newer position of the Fjalls rover – higher on the glacier but with a good signal from its base station.
See our Blog posts on data from Breida
Imaging, GPR and other Surveys
We also carried out a quadcopter imaging survey in order to create a 3D model of the Fjallsjokull margin:
This “fly through” was created by moving through the 3D model – it is not a quadcopter video. Models like this can be used to monitor the changes over time as we produce one of the same area each year.
Together with the dGPS units we carried out a GPR survey of the ice being measured at Breida’ and left a timelapse camera observing the ice margin at Fjallsjokull.
2023 next generation glacier trackers (Version 2)
We’re very happy with the concepts of our design – and many spot measurements do provide good data for analysis. We designed a new U-blox F9P based system for deployment in 2023. We were lucky to have a team of MEng students testing new ideas and programming the new circuitpython embedded systems. Thanks go to Marcus, Michael, Christian, Elliott, and Richard – we presented an EGU poster on the design. We had several design aims:
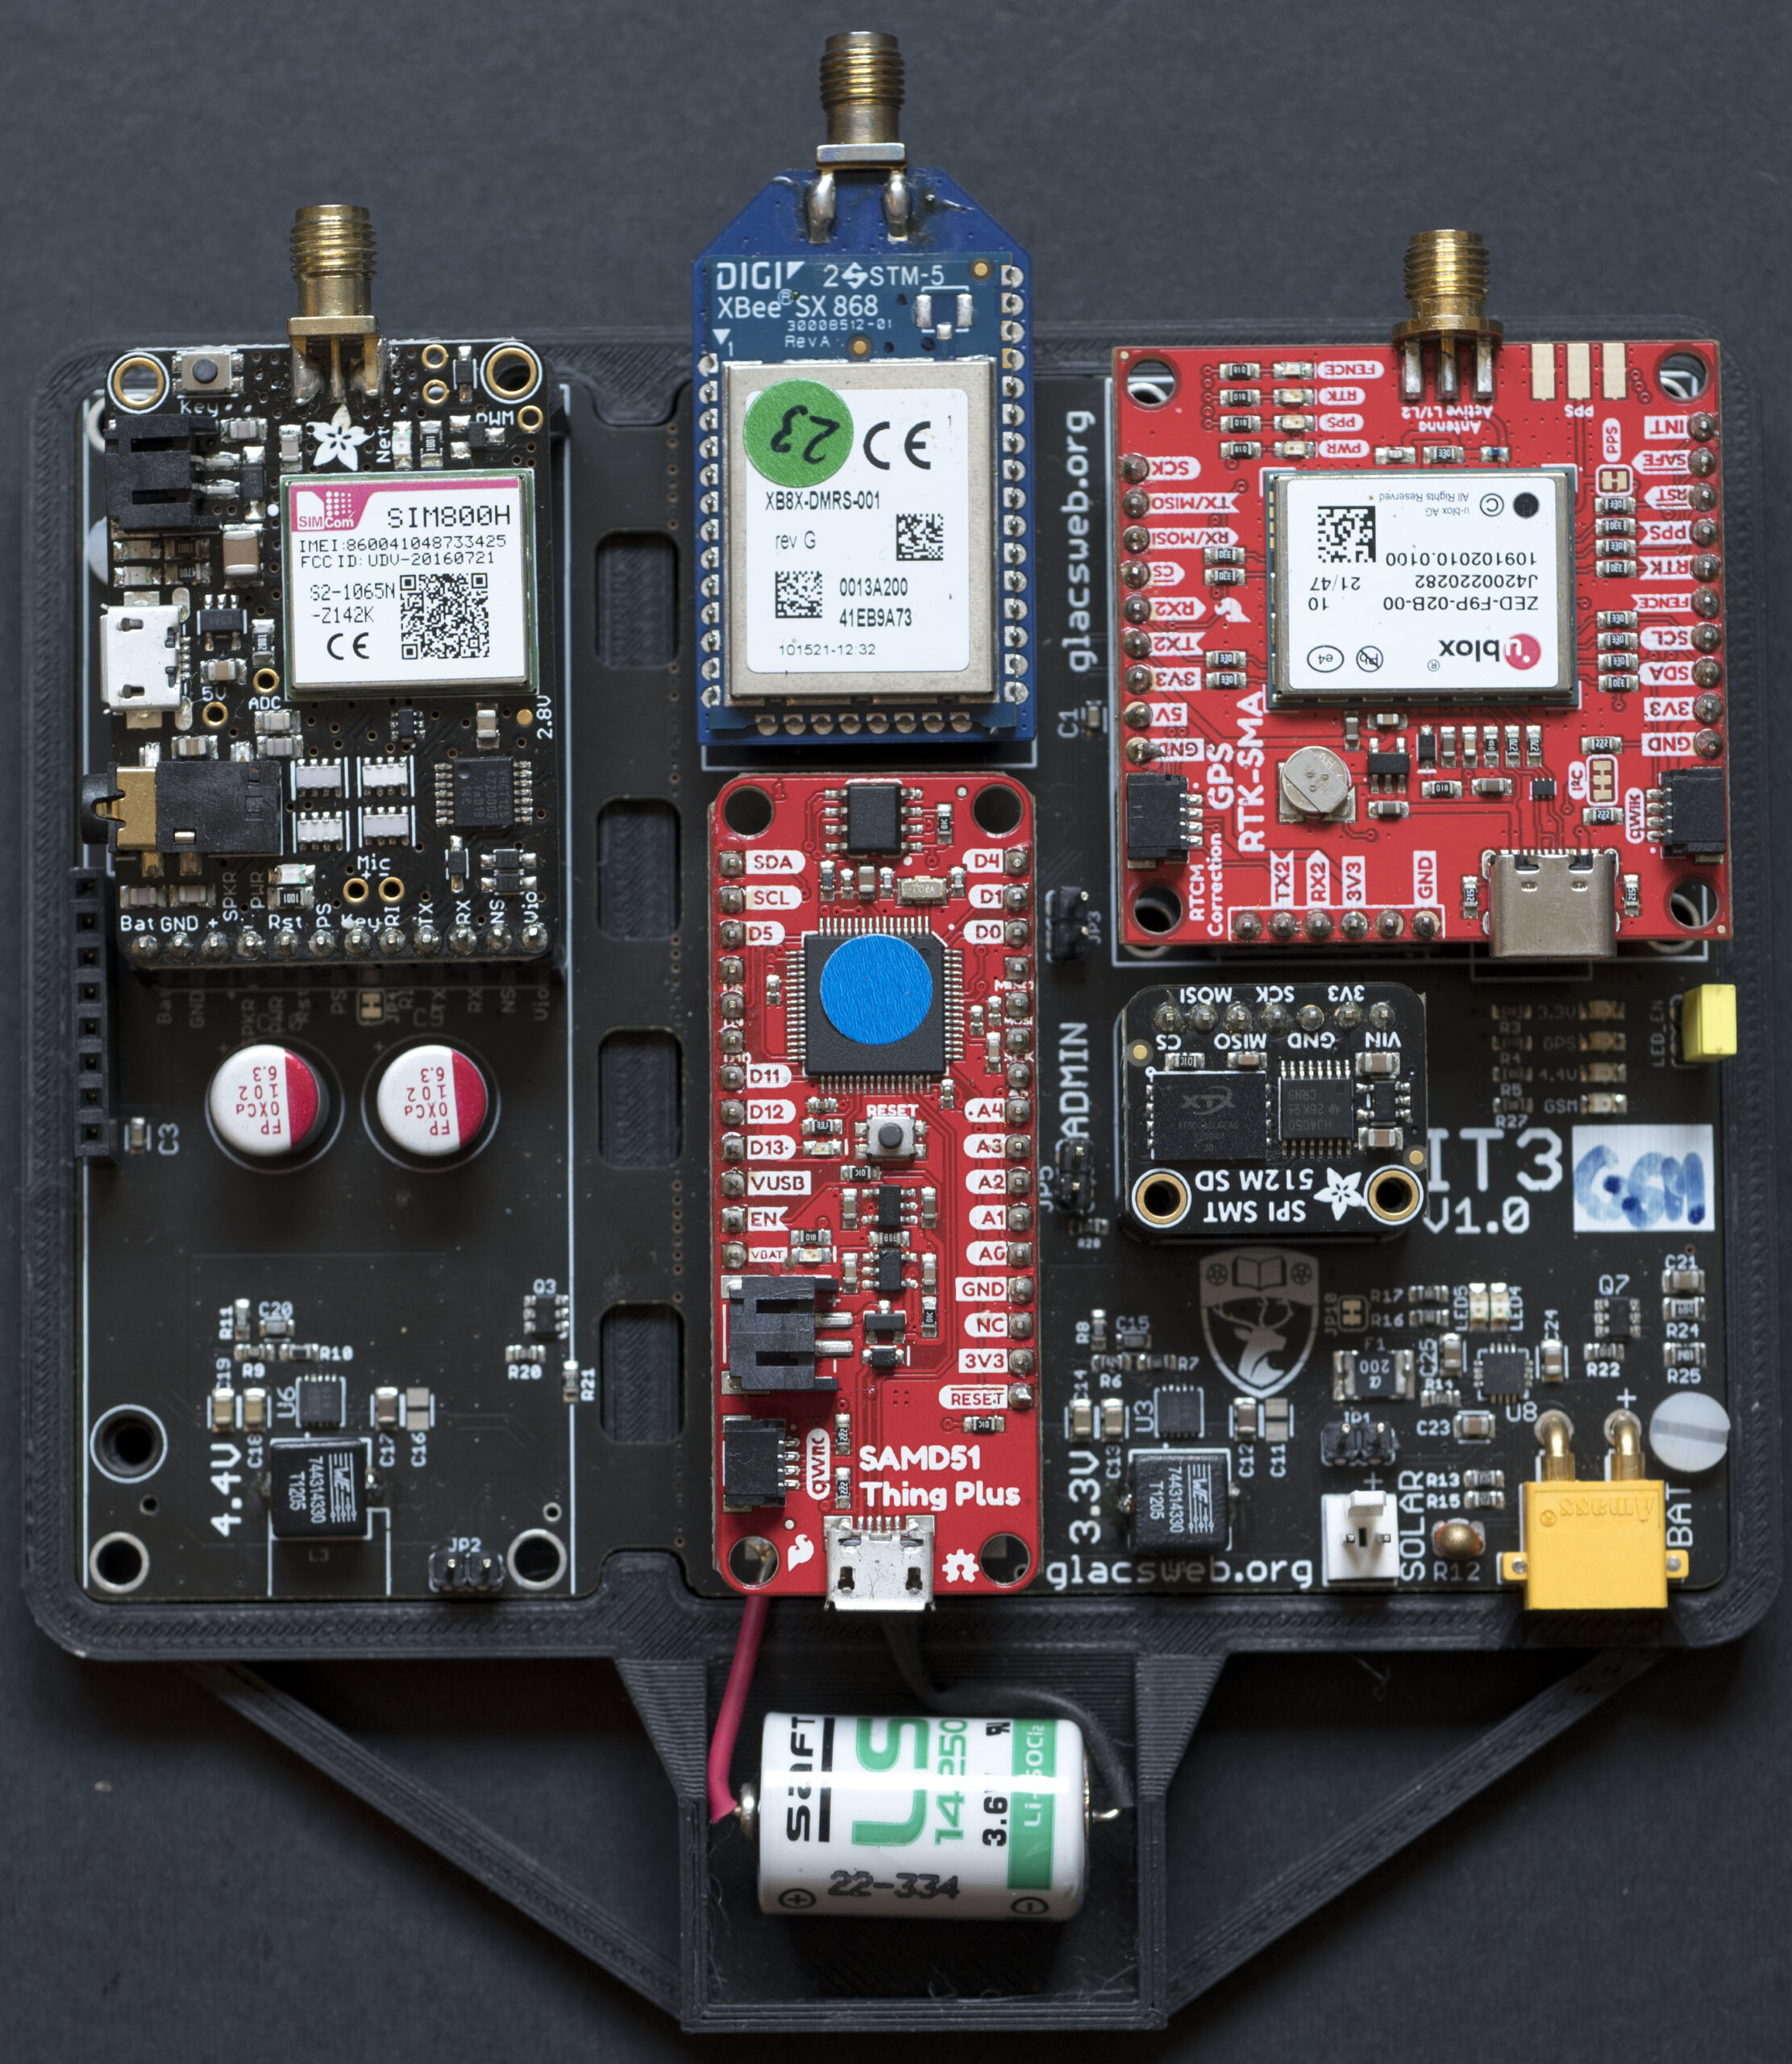
- one large lithium battery with solar charging to last through years (with small solar panel)
- trackers send their data to the base-station over the RTK radio – so they do not need off-site connectivity. Circuitpython is used to program both boards.
- base stations store readings from the rovers and send them via the mobile phone network daily. Both systems store readings in a small flash board.
- smaller and lighter design capable of being deployed with a quadcopter
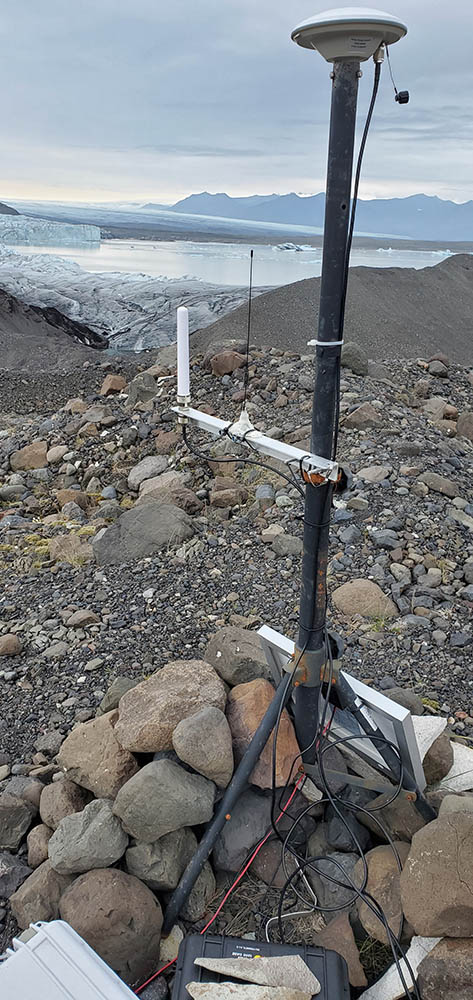
This is the new 2023 Breida base station with its GSM and RTK radio antennas (white).
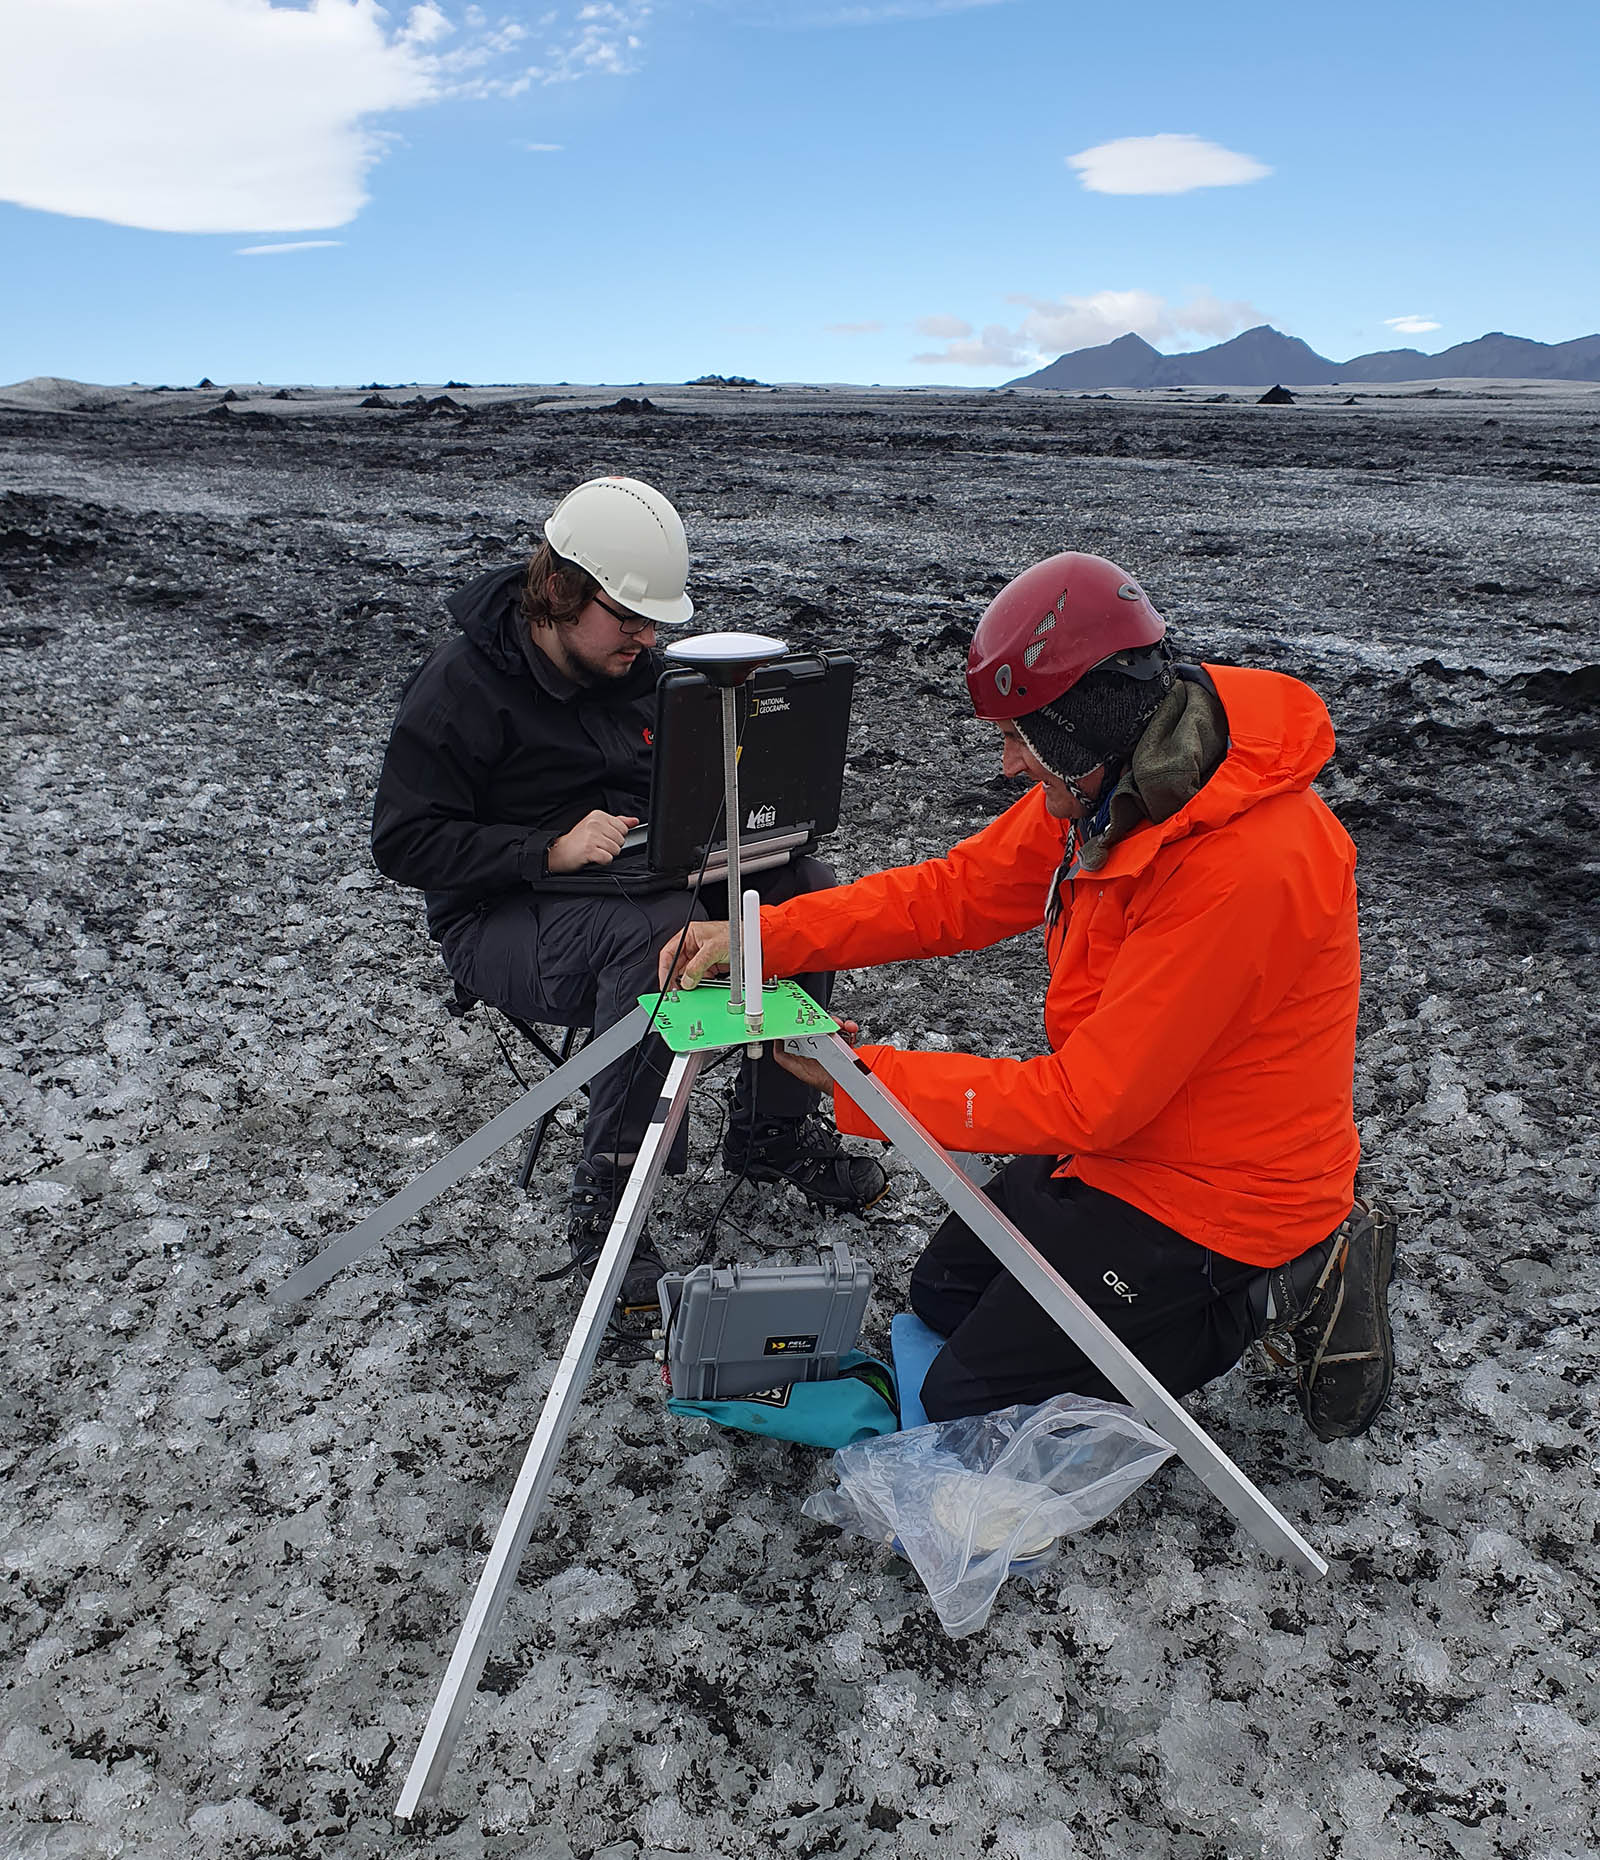
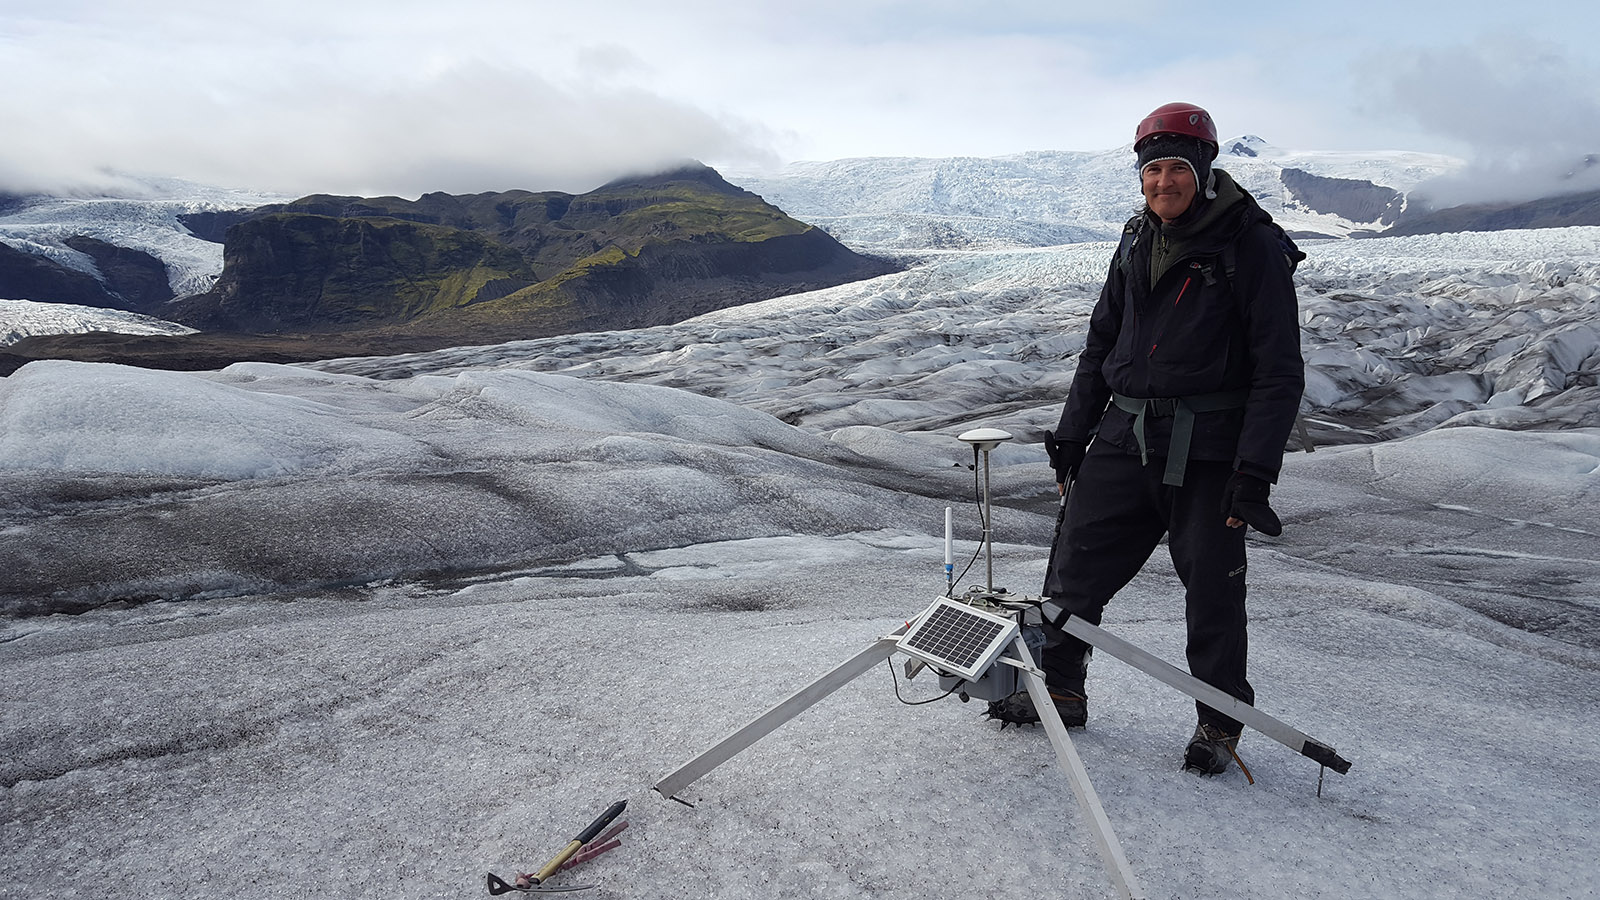
this is the lighter tracker/rover19 showing the lighter “quadpod” and Peli case being installed (with Michael Jones – computer science graduate)
The new base station at Fjalls – with its “black stick” GSM antenna and new 10W solar panel
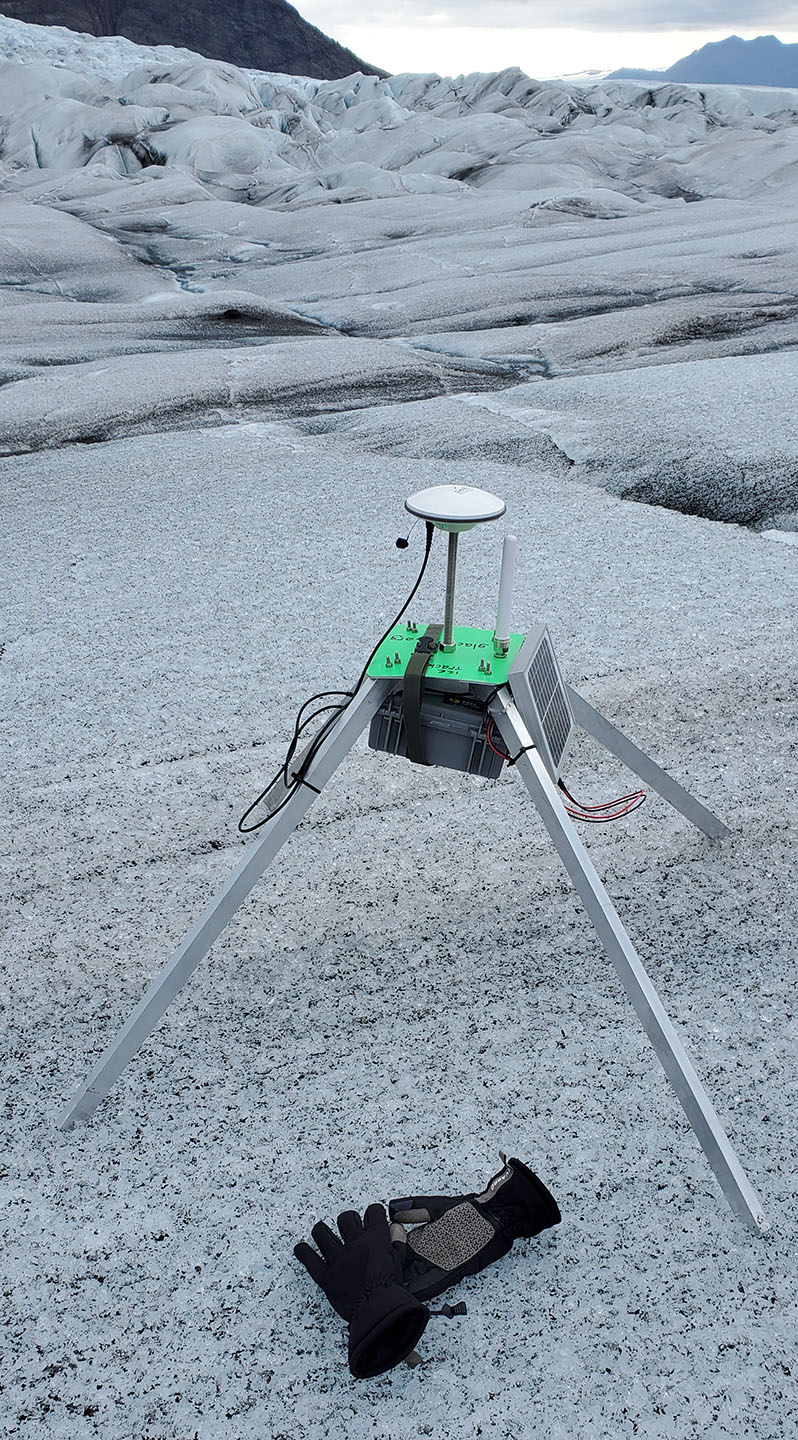
The tracker system on Fjalls – we painted the top plates to make them easier to find.
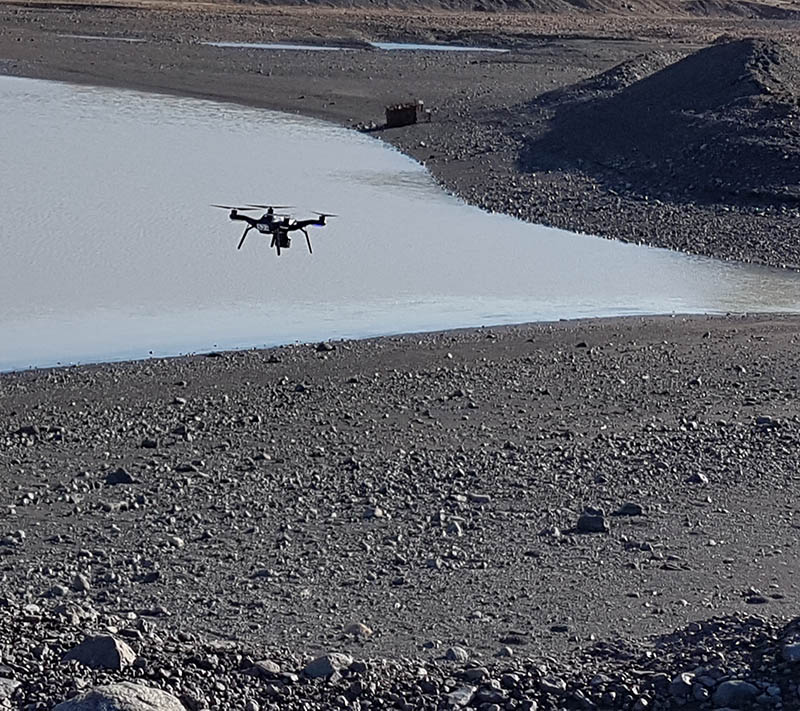
This is lightweight tracker 21 being lifted to its site around 1km away at 190m altitude. The DJI Matrice 300 can easily carry the system and we used a camera+release module (PTS4) to place it on the glacier (note: not drop it).
Other improvements include: accurate temperature sensor (in the case), battery voltage readings and taking an average position of five fixes (making readings more stable).
In a second field trip we installed some software updates and flew tracker 22 up into the centre area of Fjalls:
Again it was flown about 1.3km but this time into an area only accessible to good ice climbers. The system worked immediately and is still sending data. It is moving at around 35 cm/day.
Being high up the glacier it has an incredible “view” of the calving ice front and is surrounded by crevasses. It started at 140m altitude (ASL). and in Sept was already dropping to 3C at night.
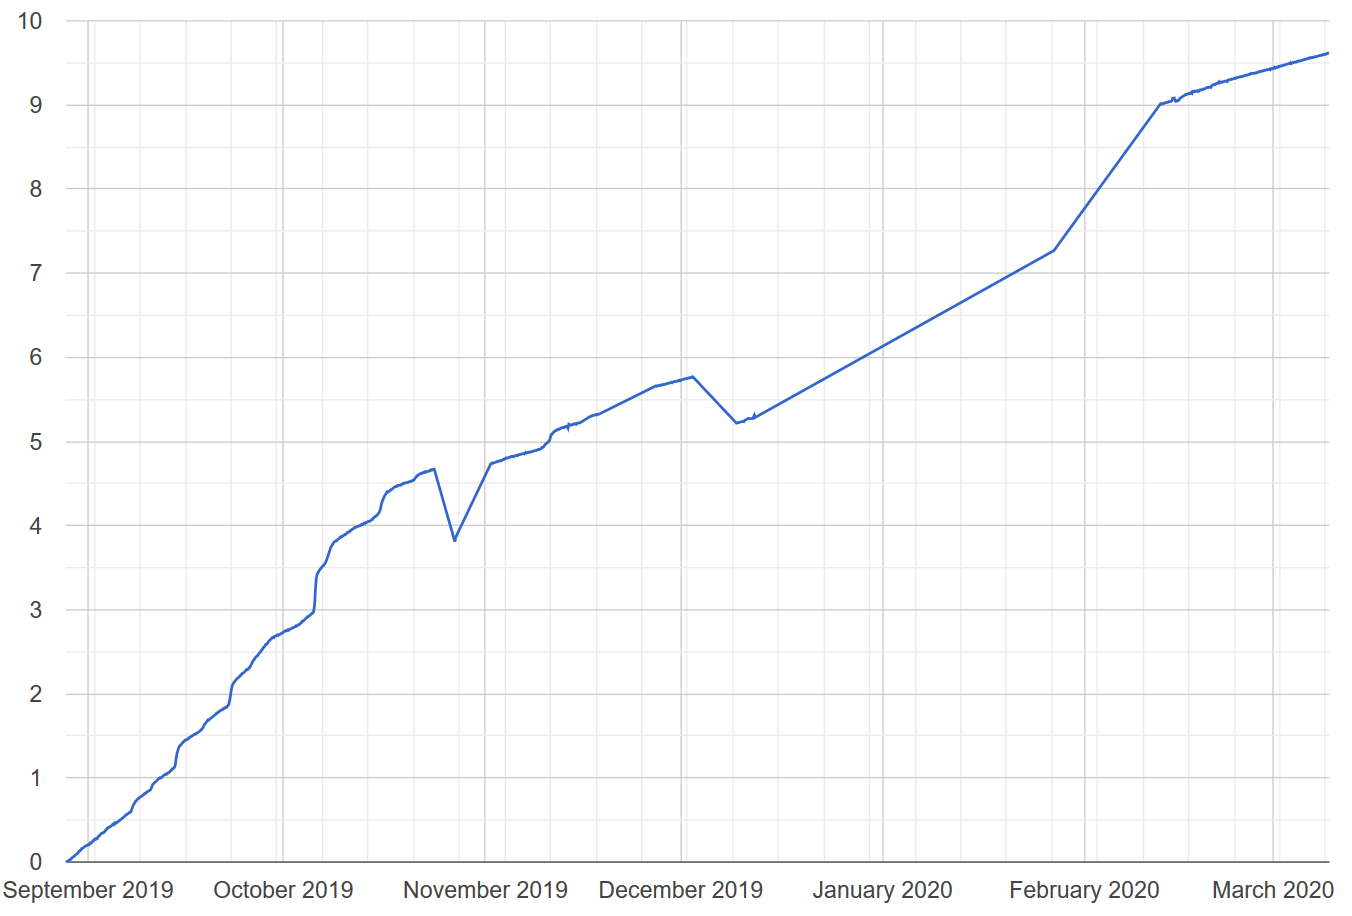
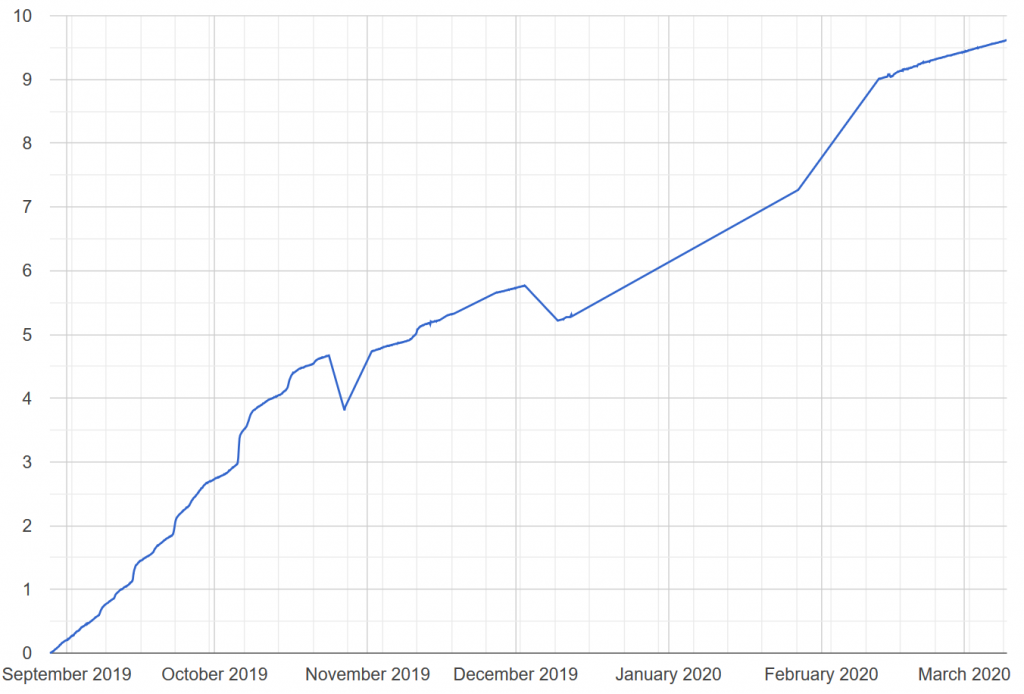
This quick plot of total distance moved shows how consistent our data is – with only one outlier. This distance includes melting vertically as well as moving.