These new dGPS units seem to be accurate to around 2cm as shown in our test. This is for a close baseline (and at the moment doesn’t use GLONASS).
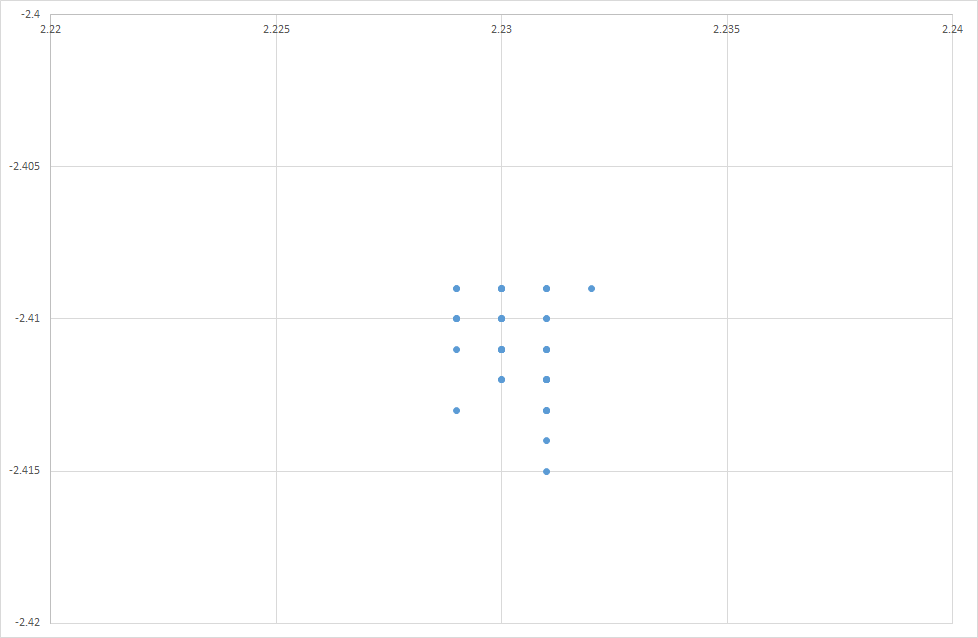
Testing the Piksi Multi from Swift Navigation. North/East relative position of rover – in a 96s test in an open space. The readings are quoted as accurate to 0.023m H 0.037m V.