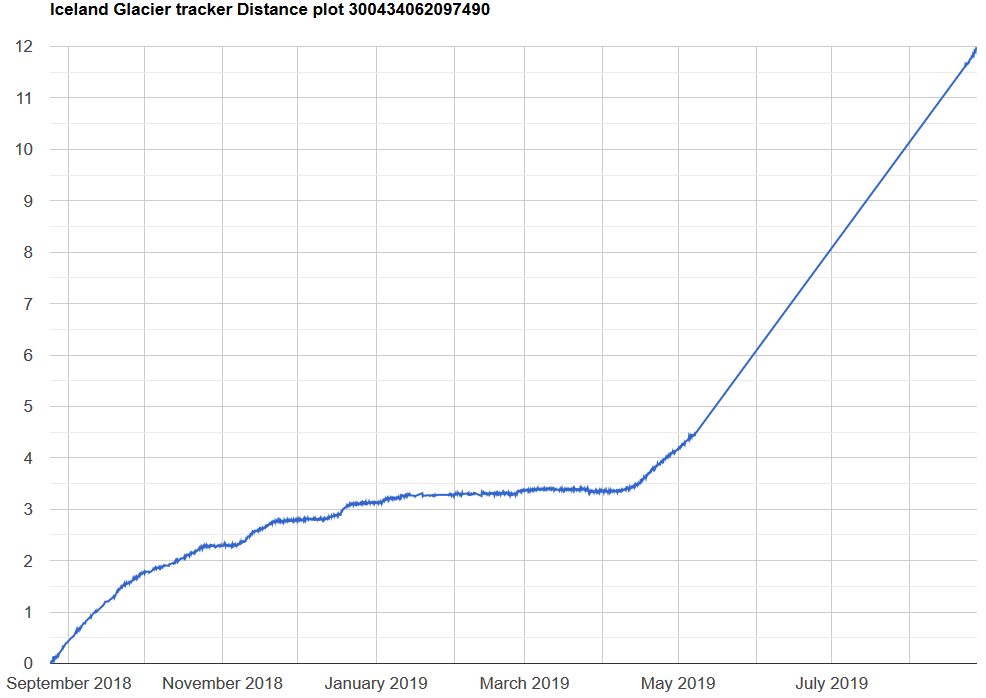
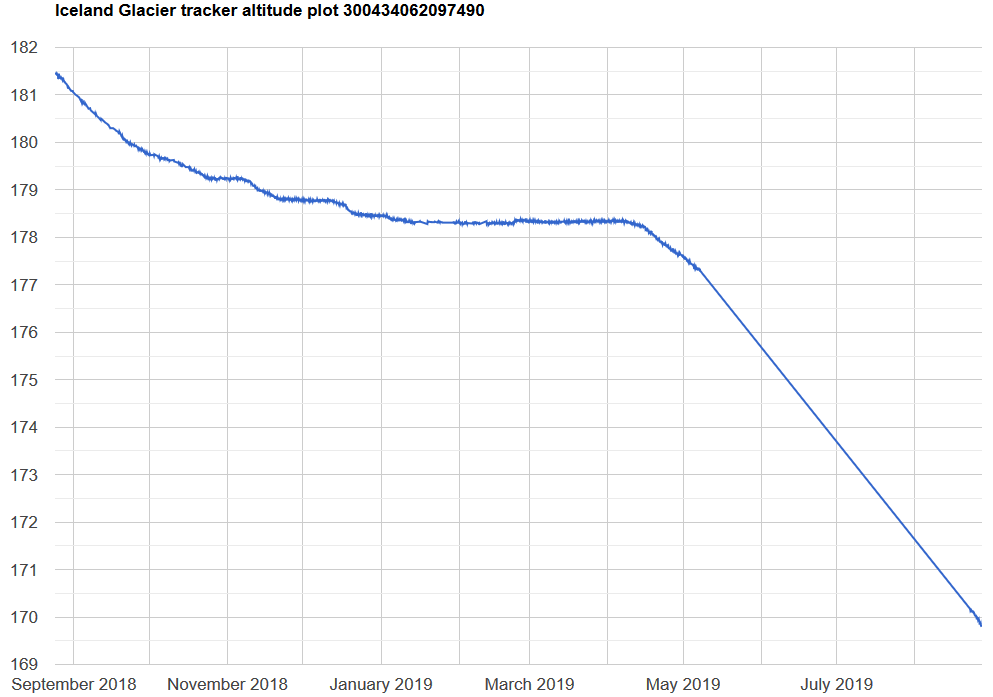
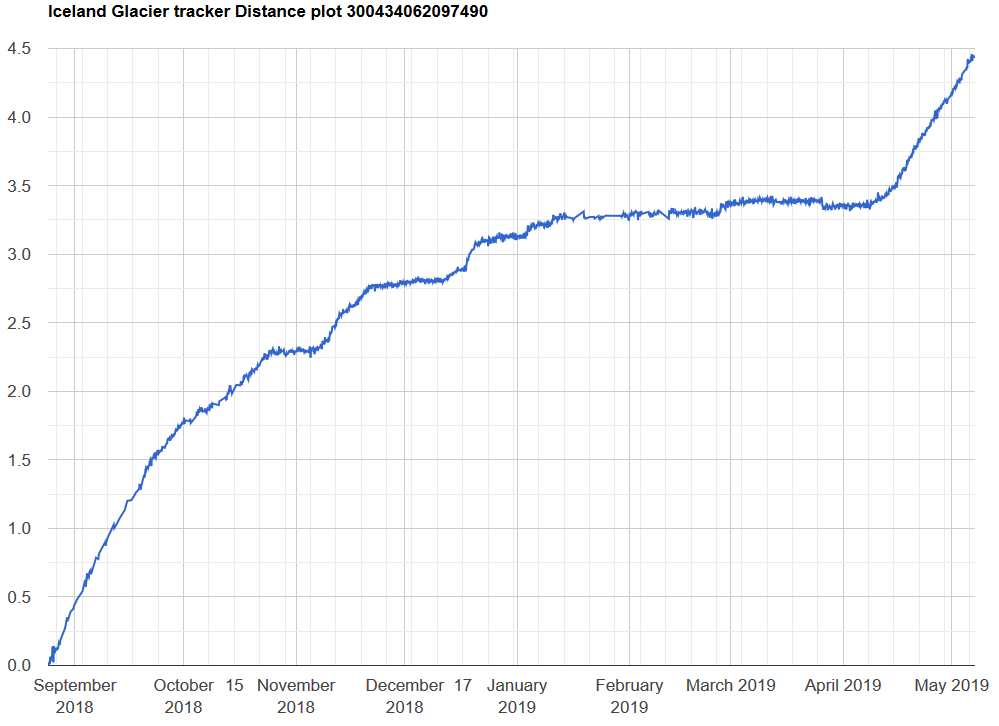
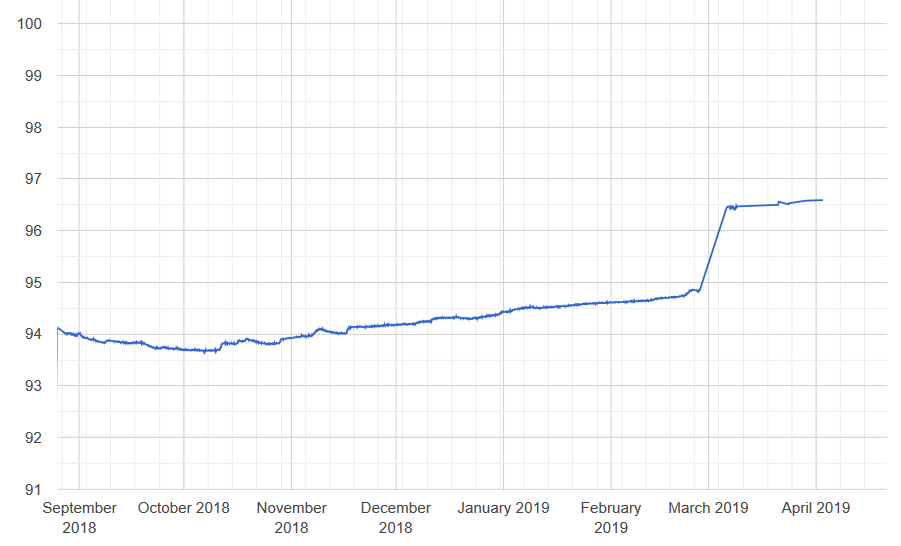
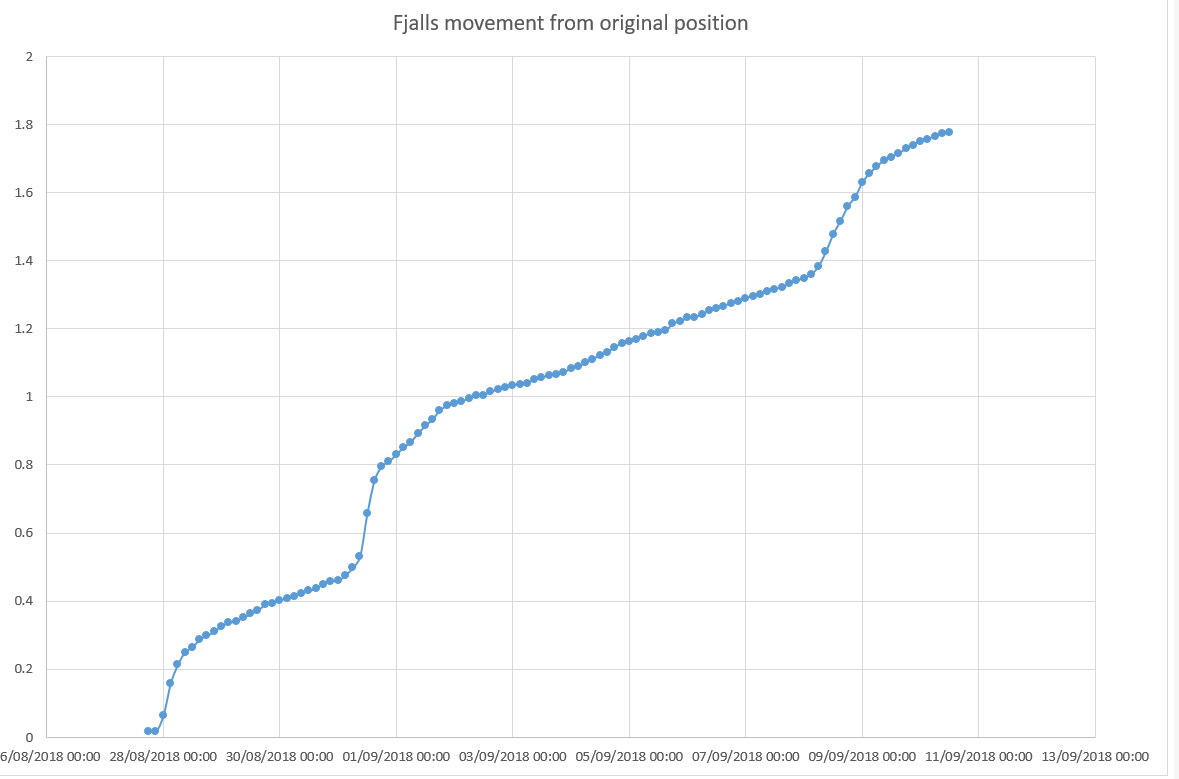
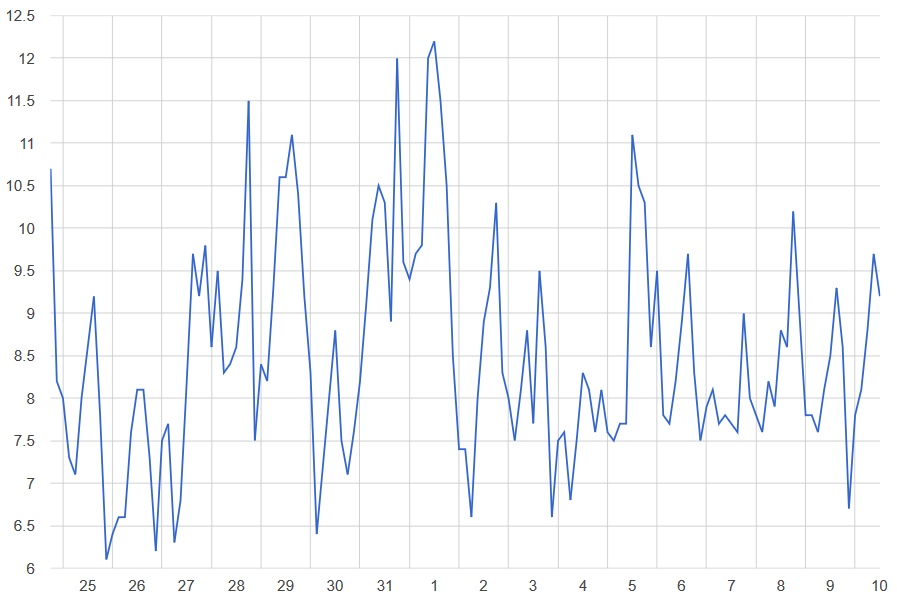
There is a nice write-up from Formula E on Ice drive: a lasting legacy:
Video of Fjallsjokull
We just edited some footage of the fjallsjokull margin
Here you can see the recently exposed foreland and its moraines.
(video taken with 3DR Solo and GoPro5 – without gimbal – hence the slight wobble)
Some movement data
October 2017 fieldwork
In October Kirk and Phil went for a quick trip to swap out the Rockblock units and reset the base station at Fjalls.
Fjallsjokull system deployed
Today we set up two dGPS units to measure the speed of some of Fjallsjökull glacier. We chose an area of ice which is clearly moving forward towards the lake.
The photo above shows a “quadpod” supporting the GPS units – which are an adaptation of those made by Matthew Roberts of the Icelandic met-office. The idea is to be strong enough to cope with winter and cast few shadows (which cause ice to grow). The system is currently measuring its position every 3hrs to an accuracy of about 2cm – using signals from the base station to help it.

the dGPS base station installed on a moraine close to the Fjallsjokull glacier. We used speaker stands burried in rocks to support the GPS antenna (top) and hold its 2.4GHz radio antenna (white stick). Shortly after this photo I accidentally kicked sand into the laptop keyboard – so it was not so easy to use after that!
Scouting for glaciers for Bergprobe in 2017
We had a look around three glaciers on our first day in Iceland in 2017 – to check for access. Here we are on the massive sandur of Breiðamerkurjökull.
ublox m8 tests
First test of Swift Navigation Piksi Multi dGPS
These new dGPS units seem to be accurate to around 2cm as shown in our test. This is for a close baseline (and at the moment doesn’t use GLONASS).

Testing the Piksi Multi from Swift Navigation. North/East relative position of rover – in a 96s test in an open space. The readings are quoted as accurate to 0.023m H 0.037m V.
Iceberg Tracker moves on but seems in trouble
We have been checking the iceberg tracker temperature as one way of telling if it is in the sea is a flatter daily variation in temperatures. Here you can see it did regularly read sub-zero at midnight then warmer an noon. Recently however it is showing mainly positive temperatures.
After spending weeks among the small islands in the centre of this map – it has moved south until reaching land again. This dramatic movement may be because the iceberg has broken up.