There’s a lot of energy in a glacial outflow river!

The outflow river bed remained almost unchanged while it was monitored from Autumn 2012 to Summer 2013. However, sometime between July 2013 and July 2014, the flow became violent enough to move massive boulders, as these images from the bridge camera show.

River bed with boulders.

River on 22 May 2013.

River bed with boulders.

River on 1 August 2014.

Note the big boulder – about 1 m high – right of centre in the foreground of the earlier image, which has been swept out of shot a year or so later.

Summer 2014

digging out a GPS station

In summer 2014 we went to collect the dGPS gear – but found most of it buried in old snow from the winter.

GPR survey of the glacier in 2014

We also did an annual survey of the ice depth with the new ground penetrating radar.


Sunrise over Skálafellsjökull

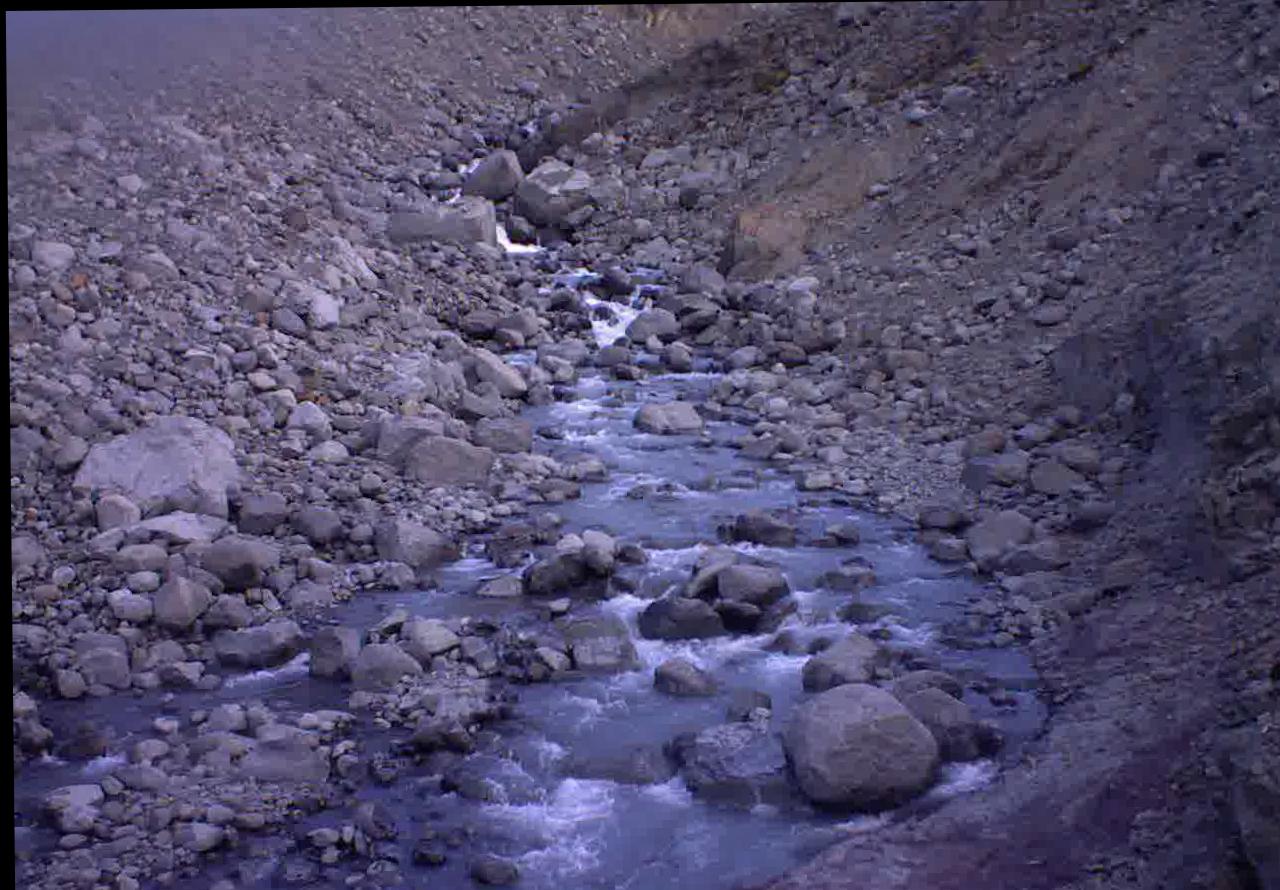
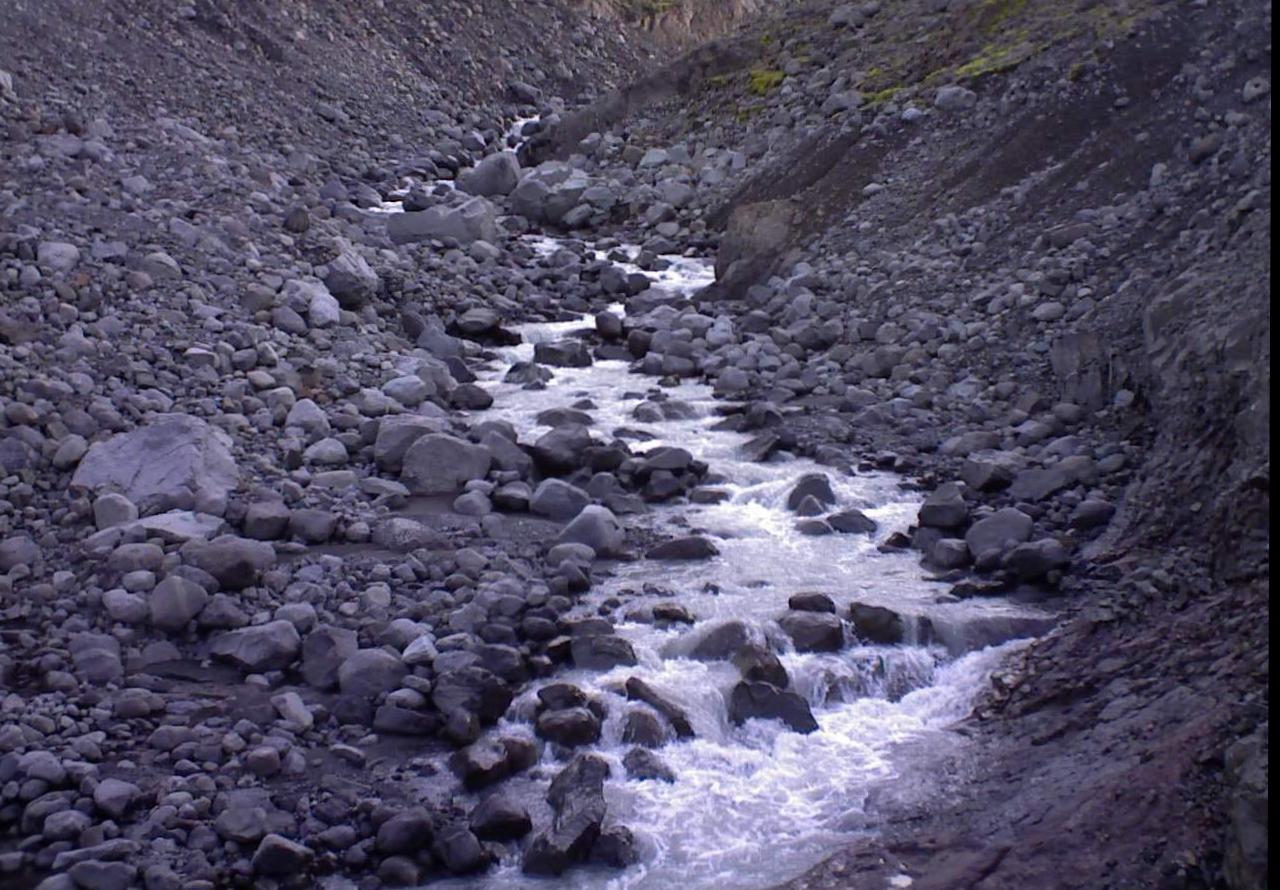
We have been analysing the time-lapse image sequences from the river camera. Mostly it recorded at 4-hour intervals, but for a couple of days in September 2012 it took pictures every minute – the sequence is shown here.

At about noon the river rises by a few centimetres. The change is hardly noticeable, but we can measure the level quite accurately with careful image analysis, and we can see it happening by watching the river start flowing over a rock in this video.

A miniature waterfall begins to flow over the edge of a rock

The river rises to flow over a rock

We would like to relate this to what is happening up on the glacier. One factor is when the sun falls on the ice, and we can work this out from a map of the terrain. Here we are using a digital elevation model from the ASTER instrument aboard the Terra satellite. (ASTER GDEM is a product of METI and NASA.) The animation shows sunlit areas on the glacier and surrounding mountains increasing as the sun rises on 25 September 2012.

Step by step animation of sunlight spreading over glacier and mountains

Simulated sunrise, 25 September 2012. Vertical scale exaggerated by factor of 5.

Getting going on CT analysis of till texture

We’re investigating the texture of till using CT scans. This shows successive sections through a sample.

Animated CT volume

Moving along the z-axis through a CT volume

The first step in the analysis is to extract the shapes of the clasts (rock fragments) embedded in the sample. These show up mainly as red in the sections above. The shape below is a clast about 3 mm long.clast

Moraine Camera captures first snow of 2013

This simple camera test used our "snow-cape" linux-based Beaglebone computer and a normal logitech webcam. It connected directly via 16km Wifi to Holmur!

This simple camera test used our “snow-cape” linux-based Beaglebone computer and a normal logitech webcam. It connected directly via 16km Wifi to Holmur! (photo Aug 2014)

We are occasionally getting pictures from the camera set up on the moraine of the glacier.

Moraine without snow

Taken on 05/10/2013, with no snow visible

Moraine with snow

Taken on 07/10/2013, with snow visible

Working on the 2013 base station

Here you can see the new shape of the 2013 base station - without wind generator (extra solar panels instead), new panel Wifi antenna on the top, new camera just below that and Topcon dGPS on the very top now. The structure has been reinforced with recovered parts from the damaged and decommissioned GPS pyramid.

Here you can see the new shape of the 2013 base station – without wind generator (extra solar panels instead), new panel Wifi antenna on the top, new camera just below that and Topcon dGPS on the very top now. The structure has been reinforced with recovered parts from the damaged and decommissioned GPS pyramid.